
Please note that this article was previously published in H2O’s Water matters
Summary
With this study, the Limburg drinking water company WML and consultant Spatial Insight close the circle of generating, processing and using data in the management of a drinking water network (plan-do-check-act). Combined asset and failure data are leveraged to determine the optimal ratio between performance, costs and risks of the distribution network. In other words, data-driven asset management that makes use of integrated spatial data and data-science techniques such as machine learning and regression analysis. The optimized replacement strategy reduces the inconvenience for citizens as well as the societal costs of managing underground pressurised infrastructure.
Introduction
Waterleiding Maatschappij Limburg (WML) drinking water company replaces 1.25% of its distribution network annually. This is a higher percentage than what is average in the Dutch water sector. Will it be necessary to maintain this percentage in the next decade? WML, together with consultant Spatial Insight, investigated whether data-driven asset management could responsibly reduce replacement investments.
In 2019, WML received the ISO-55001 certificate, belonging to the international standard for systematic asset management. WML’s question in this study is whether it will be necessary to continue to replace 1.25% of the distribution network annually over the next decade.
Objective decision on optimal replacement rate
The – often unintended – influence of personal preferences of staff on asset management decisions can be limited by relying upon objective data, and by defining calculations in such a way that they focus on the strategic business objectives. This will result in consistent, optimal and reproducible decisions. The strategic goal is to achieve the lowest societal costs while minimising inconvenience to citizens. In addition, WML is looking for a way to easily adjust asset management in the future.
In order to find an objective and reproducible balance between performance, costs and risks of the distribution network, both internal and external failure and asset data are used.
The performance of the distribution network is defined as the extent to which the network is able to meet the water supply requirements. This is enforced by law, demanding a pressure of 15 MWC (metres of water column) at a flow rate of 1 m3/hr at each customer’s water meter. In addition, WML sets conditions with regard to sensitivity to pressure fluctuations, undesired resistance and hydrant flows.
The replacement rate of the network is used as a measure of cost. The number of leaks has been chosen as parameter for the risk in this study.
Integrated data
Uniform and integrated data are required for modelling. In this study, we have two types of (spatial) data: failure data and data about the pipeline network.
WML uses SAP’s ERP (enterprise resource planning) software to register failure data. Data of the second type, about the location of pipes and their characteristics (such as material, year of construction and diameter) are recorded in a database of Smallworld.
Overarching, data warehouse ADI (asset data integrator) has been installed, which unifies both types of spatial data, relates them to each other and makes them accessible. ADI combines even more data, such as the activities of other network operators, KLIC (cable and pipeline activities information) reports and, in the near future, process data such as the flow rate of the treatment plants and pressures. In the daily data refresh, the quality of new entries is automatically checked and discrepancies are identified. For example, if a repair to a PVC pipe is reported, but the database shows a steel pipe at the same location, then either something went wrong with the registration, or the original data was incorrect. When it has been assessed what the correct information is, the database is updated accordingly.
Modelling with spatial data
Using a regression analysis on WML’s own data and data from USTORE (the joint failure database of the Dutch drinking water companies), the failure characteristics for various materials and ages of pipes were recalculated. A sensitivity analysis was also carried out using the TransparantNL knowledge model, which showed that some parameters have a dominant influence on the calculated replacement year. These included parameters such as the proximity of a shopping mall and high pressure in combination with PVC pipes near pumping stations. Other parameters, including the number of historic leaks, had a lower effect than expected.
Machine learning
Machine learning is a method of deriving relationships between parameters from training data and creating a predictive model. The training data is separated from the historic dataset, the remaining part is used to validate the algorithm. We applied machine learning to groups of pipes that together contribute on average to the largest number of leaks, by means of a cluster analysis. The identified clusters appeared to be the same as the new problem areas identified by engineers of WML. In practice, the water supply consultant now proactively informs the pipeline operators about vulnerable areas and plant renovation based on the results of the cluster analysis (example in Figure 1).
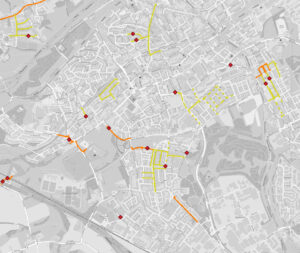
Figure 1. Larger and smaller projects as determined by the cluster analysis
Yellow, orange and red lines: the replacement priority of pipes. Dotted lines: pipes that have been removed. Red diamonds: places where leaks have actually occurred. Most leaks occur at spots identified in the cluster analysis.
Finally, for various replacement scenarios, the number of leakages to be expected and the corresponding development of the average age of the network were calculated. Figure 2 shows the effect of a higher or lower replacement rate, on the number of leakages in the coming decades. The reference is the continuation of the replacement strategy from the period 2016-2020, being a fixed replacement rate of 1.25% per year.
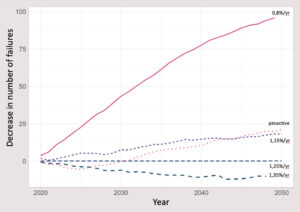
Figure 2. The effect of the annual replacement rate on the expected number of additional failures Reference is the ‘1.25% per year scenario’. ‘Proactive’ is the scenario in which, on the basis of cluster analyses, more than 1.25% is replaced per year for the first 10 years and less later.
Decision
Based on the modelling results, WML has decided to maintain the replacement rate of 1.25% per year for the time being, but to proactively replace more pipelines in the calculated clusters. This is expected to reduce the number of leakages per year. Leak-based replacement will be reduced, creating more opportunities to execute renovation works with third parties or to solve other bottlenecks in the pipeline network.
Coordination with other network operators
In order to achieve the lowest societal costs and limit inconvenience to the environment, WML aligns its pipe replacement activities with other parties, such as network operators, municipalities and the province. WML, Enexis and a number of Limburg municipalities use the SynergieNL tool for this goal. The network operators upload their planned work in a standardised manner and discuss it periodically. Before doing so, WML has already applied a prioritisation tool to determine which activities are eligible for cooperation. In the coordination meeting, it is determined for all overlapping projects whether it makes sense for one or more parties to adjust their own planning and ‘follow’ the other(s). Finally, a quarterly review with WML’s project execution department shows whether the planned projects have actually been executed.
The described long-term planning and coordination with other parties, have decreased the ratio of updates and changes in the planning of WML’s executive department from around 40% in 2016 to less than 10% in 2020. This has been achieved by, together with Enexis, engaging with all municipalities and the province, by executing plans as scheduled (‘agreed is agreed’) and by continuous monitoring of the projects in the prioritisation tool. As a result, all parties can rely upon their planning thus reducing frustrations and unnecessary costs for preparations and disinvestments. An additional advantage of the project coordination tool is that Enexis and WML always work with the same up-to-date data and that staff can be replaced during a consultation while having access to the available data needed to make optimal decisions.
After this coordination, the selected projects go through the implementation process of hydraulic design, implementation and execution, including registration in the GIS system. During all these phases, data is enriched or added to the project area and used again afterwards for analysis purposes. For example, some analyses are automatically performed on completed projects, such as checking ‘selected pipes replaced’, ‘sectioning’ or ‘dead ends’.
If a gas pipe has recently been replaced within two metres of an existing drinking water pipe, the failure frequency turns out to be significantly higher – up to four times higher than for pipes in which proximity no gas pipe has been replaced. Leaving the former water pipes in place therefore increases the risk of failure. This example underlines the urgency of good coordination and cooperation with other parties. In the near future, research into the influence of third-party activities should result in a predictive model.
Implementation in operations and policy
The complete replacement process has been assigned to the chairman of WML’s renovation team. In his role as linking pin, he ensures cooperation with the various internal departments and with Enexis, the municipalities and the Province. In addition, various tools were developed to control and monitor the processes and the projects.
In the short term, automated checks can be carried out at project level. In the medium and long term, the effects of the replacement strategy will become measurable. This will give the asset manager the opportunity to alter the strategy and thus impact the anticipated effects.
The annual plans for 2018, 2019 and 2020 have already increasingly been aligned with the results from the knowledge model. WML is now so convinced of the additional quality insights from the cluster analysis that the impact of the strategy of 1.25% replacement per year will be increased by integrating the results of from the cluster analysis in the coming years. By doing so, WML is one of the first Dutch drinking water companies to implement all the elements of data-driven asset management needed to close the Deming circle (plan-do-check-act) from the ISO-55001 standard, including data registration and integration, modelling, decision-making and coordination of activities.
WML considers the cluster analysis to be a very powerful and valuable tool to generate short-term replacement plans. The TransparentNL knowledge model is more suitable to generate medium- and long-term replacement plans. By combining these two approaches, an optimum working method will be applied in the coming years. WML does however emphasise that these knowledge models will always be decision support models – and not ‘crystal balls’.


