Please note that this article was previously published in H2O’s Water matters
Summary
The impacts of drought are increasing worldwide, as well as in the Netherlands. Thorough drought risk analyses are becoming increasingly important. A recent inventory in collaboration with the World Bank shows that approximately 200 open-source, online information sources, data sets and other tools are available worldwide to identify drought risks. An analysis of those products demonstrated that the meteorological aspects are often taken into account, but the impacts of drought are not. Information on exposure and vulnerability to drought from different groups, sectors and areas is essential to conduct proper risk analyses. For the Netherlands as well, the risk approach to drought could be better, and some global products could certainly be useful when considering the Dutch situation.
Introduction
In recent years, countries and regions around the world have been hit hard by drought or aridity, with major consequences for agriculture, drinking water supplies and energy production. The Netherlands also experienced unprecedented aridity in 2018, with low discharge from the Rhine coinciding with a significant precipitation shortfall. Developing an effective drought policy is becoming increasingly important the world over. The first step is to prepare a thorough drought risk analysis.
A drought risk analysis is an indispensable first step for decision-making and for taking measures before, during and after drought or aridity. But what information is required to get a handle on drought, drought risks and perspectives for action? A substantial amount of measurement data, indicators, models, online platforms and other tools are available. Are these resources adequate or is some information missing? How can you visualise drought? Should drought analyses be carried out in the same way everywhere?
Professionals and policymakers around the world are finding it difficult to navigate these questions. And this difficulty has been recognised by the World Bank. Guidelines for drought risk analysis have been developed in collaboration with a consortium of Dutch and international experts (World Bank 2019). To better support drought risk analyses worldwide, as well as in the Netherlands, drought-oriented products and data sets have been inventoried.
Aspects of drought risks
Drought risk analysis combines information pertaining to three aspects:
- ‘hazard’: meteorological and hydrological data on drought within an area;
- ‘exposure’: information about the water requirements of sectors and water users;
- ‘vulnerability’: information on the vulnerability of those sectors and water users and their options for coping with and recover from the effects of the drought.
Global availability of drought products
The inventory lists online and open-source products and data sets that specifically target drought (see www.droughtcatalogue.com). Globally, approximately 200 products (indices, data sets, newsletters, tools, software and online platforms) are available for drought risk analyses (Deltares, 2018a). This inventory is not exhaustive. New products are constantly being developed, and there are many products that contain basic data for drought analyses, but are not specifically aimed at drought. A good example of this is the Copernicus Climate Data Store (https://cds.climate.copernicus.eu), which is constantly evolving and is becoming an increasingly important source of climate information both on a global and European scale. The compiled catalogue displays the most important features and applications for each product, along with information about availability and contact persons.
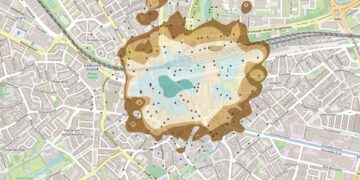
Most drought products concern meteorological, agricultural and hydrological information. In particular, there is a wide range of products available for meteorological drought. There are scarcely any products on offer about the impact of drought, and there is little information about exposure and vulnerability (Illustration 1). To obtain a thorough drought risk analysis of an area, local information on exposure and vulnerability is always critical.

Illustration 1. Drought products available per region, distinguishing between hazard mapping, monitoring and (seasonal) prediction, impact mapping and risk mapping
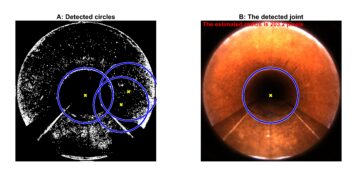
The applicability of the inventoried products has been validated with historical information on droughts (Deltares, 2018b). Illustration 2 is an example of an analysis conducted for Afghanistan. This shows that global meteorological and hydrological data sets and models (like PCR-GLOBWB and WaterGAP) form a good basis for characterising the drought hazard on a national scale and for setting up seasonal drought forecasts. The few data sets and products that represent the impacts and risks of drought, however, do differ significantly from one another (examples include the Global map of drought risk (Carrão et al, 2016) and EM-DAT, The International Disaster Database (https://www.emdat.be/). Such products can only be used for an initial insight into the main risks of drought, and additional verification with local data or information is essential.

Figure 2. Global drought data applied for Afghanistan: the SPEI3 meteorological drought indicator based on the data sets of PCR-GLOBWB (above) and WaterGAP (below). The grey areas at the top indicate the years in which a drought was recorded in The International Disaster Database EM-DAT as well as local reports. The Y-axis indicates the percentage of land surface affected by light drought (SPEI <-1.0), moderate drought (SPEI <-1.5) and severe drought (SPEI <-2). Source: Deltares, 2018b.
Guidance for drought risk analyses
The World Bank’s new guideline (World Bank, 2019) states that drought risk analyses can serve a range of purposes. Not only can they be part of a regional or national survey, but they can also focus on a specific issue, such as securing financial support for small farmers. To ensure that the analysis is a good match for the objective, the guideline describes four basic principles.
Basic principle 1. Prioritise the impact of the drought
It is crucial to begin with an inventory of the actual and potential effects of drought. For example, if the drinking water sector is primarily dependent on groundwater, an assessment of the drought characteristics in relation to the replenishment of groundwater and groundwater reserves is important. For small farmers who use local rainwater reservoirs, precipitation and evaporation are relevant (meteorological drought), while the shipping industry and a hydroelectric station require information about river discharges and water levels (hydrological drought).
Basic principle 2. Choose the perspective that suits the system
A drought risk analysis should be carried out on the right scale. This depends heavily on the actual or potential consequences of drought and the vulnerability of the exposed sectors. A risk analysis of small communities that depend on local rainwater during the growing season requires a different approach than a risk analysis of hydroelectric stations that depend on river discharge from an entire river basin for a prolonged period. To obtain a clear picture of the extent to which drought risks play a role, it is vital to involve all of the relevant local stakeholders early on in the analysis. Combining local knowledge with scientific information facilitates the establishment of a common knowledge base.
Basic principle 3. Consider the changes in drought risks in the future
Climate change and socio-economic developments influence future droughts and water shortages. If the purpose of the drought analysis is climate adaptation or a long-term solution strategy, it is important to include these changes. While climate change mainly influences the characteristics of the drought risk, socio-economic development influences the exposure of sectors and water users and their vulnerability.
Therefore, when choosing adaptation measures, one must think about the potential negative side effects. For example, drilling wells to compensate for a water shortage can alter the hydrological system so that a future drought becomes more severe.
Basic principle 4. Effective drought policy improves both resilience and preparedness
Beyond short-term relief actions during or after a drought, a good drought policy is also critical. To that end, well-organised governance, clarity about priorities in the event of drought, clear sector and area-specific management objectives and roadmaps are very important. Systematic preparedness is also significant: early warning and monitoring are crucial for short and long-term drought management.
Risk approach to drought in the Netherlands
Especially after the 2018 drought, there has been a greater need for a risk approach to drought in the Netherlands. Better availability of local and national drought products is desirable. After the 2018 drought, water managers indicated that the information provided has been very fragmented. In the Netherlands as well, products that map the impact and risks of drought are still developing apace.
Many of the products from the inventory are hardly used, if at all, and the usability of, for example, drought indicators from other countries is not yet well known. Research is required to map out the situation regarding the drought products. One conclusion (see the first basic principle) is that the impact of the drought must be central and that drought indicators should indicate this impact as much as possible. That these impacts may differ for various sectors and areas is also important. For example, this could mean that other indicators are relevant for the higher-ground sandy soils in the Eastern and Southern Netherlands than for the Western Netherlands.
There are already existing projects and initiatives that focus on a risk approach and on better availability of drought products. Examples include the Freshwater Economic Analysis (from the Delta Programme), the IMPREX project and the DigiShape Drought testing ground.
References
- Carrão, H., G. Naumann, P. Barbosa (2016) Mapping global patterns of drought risk: an empirical framework based on sub-national estimates of hazard, exposure and vulnerability. Glob. Environ. Chang., 39 (2016), pp 108-124, 10.1016/j.gloenvcha.2016.04.012.
- Deltares (2018a). Report 11200758-002. Hendriks, D. M. D., P. Trambauer, M. Mens, M. Faneca Sànchez, S. Galvis Rodriguez, H. Bootsma, C. van Kempen, M. Werner, S. Maskey, M. Svoboda, T. Tadesse, and T. Veldkamp. Global Inventory of Drought Hazard and Risk Modeling Tools. https://www.droughtcatalogue.com/en/index.php/about.
- Deltares. (2018b). Report 11200758-002. Hendriks, D. M. D., P. Trambauer, M. Mens, S. Galvis Rodriguez, M. Werner, S. Maskey, M. Svoboda, T. Tadesse, T. Veldkamp, C. Funk, and S. Shukla. Comparative Assessment of Drought Hazard and Risk Modeling Tools. https://www.droughtcatalogue.com/en/index.php/about.
- Scott, Michon and Rebecca Lindsey (2017). State of the climate: Global drought. https://www.climate.gov/news-features/featured-images/2017-state-climate-global-drought
- World Bank, 2019. Assessing Drought Hazard and Risk: Principles and Implementation Guidance. Washington, DC: World Bank. https://www.droughtcatalogue.com/en/index.php/about.
- World Bank (2019). Assessing Drought Hazard and Risk: Principles and Implementation
- Guidance. Washington, DC: World Bank. https://www.gfdrr.org/en/publication/assessing-drought-hazard-and-risk
Global meteorological and hydrological data sets and models
- PCR-GLOBWB: https://www.globalhydrology.nl/models/pcr-globwb-2-0/
- WaterGAP: https://www.uni-kassel.de/einrichtungen/en/cesr/research/projects/active/watergap.html
Data sets and products that show the impact and risks of drought
- Global map of drought risk from JRC: in Carrão et al, 2016
- EM-DAT: The International Disaster Database https://www.emdat.be/
- IWMI: https://waterdata.iwmi.org/Applications/Drought_Patterns_Map/
- FAO platform: https://www.fao.org/giews/earthobservation/asis/index_1.jsp?lang=en
- Aqueduct: https://www.wri.org/our-work/project/aqueduct
- African Drought Observatory: https://edo.jrc.ec.europa.eu/ado/ado.html
Dutch risk approaches to drought
- The Freshwater Economic Analysis from the Delta Programme: https://www.deltacommissaris.nl/deltaprogramma/gebieden-en-generieke-themas/zoetwater/onderzoeken
- IMPREX project: imprex.eu
- DigiShape Drought testing ground: https://www.conexys.nl/digishape/

