During the first wave of COVID-19 in the spring of 2020 it proved to be possible to monitor the presence of virus particles of the new pathogen in sewage. That led to a project plan to develop sewage surveillance as a way of monitoring SARS-CoV-2 at village or neighbourhood level. That project has proven ground-breaking for the analysis of virus variants in sewage and for the analysis of the relationship between ‘sewage data’ and data on positive tests, visits to doctors and hospital admittances.
Purpose of the study: to capture the infection pyramid
The basic idea behind the study was the so-called ‘surveillance pyramid’ (see illustration 1). The top of the pyramid represents patients who have died, the second layer patients in hospital, and the third concerns patients diagnosed by a GP. The fourth layer represents infected persons who have been registered via testing centres or other health systems. The fifth layer are people with symptoms and the sixth layers are carriers, including people with no symptoms.
The top three layers are monitored using registrations by the Public Health Authority, GPs and hospitals, referred to collectively in this project as ‘above ground’, while the bottom layer, the carriers, are monitored by means of sewage surveillance, referred to in this project as the ‘underground’. At an early stage of the pandemic, it became clear that the above ground surveillance was missing much of the transmission of SARS-CoV-2.
In this project, we investigated how data from different sources and layers of the pyramid support each other. In selecting the locations for the study we endeavoured as far as possible to link layers in the pyramid by looking for sewer districts with the best possible overlap with the territory covered by a GP-practice. Data from the GGD testing centres are also associated with sewer districts through ZIP codes. Because of privacy legislation, the research team could work only with anonymised data. For data from testing centres, for example, for each test result that includes only the date and the result per sewer district, emphatically no names and addresses.
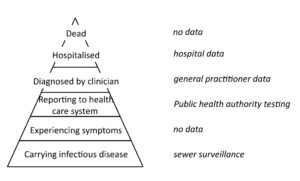
Figure 1. Infection pyramid with the data used per layer (Nieuwenhuijse and Koopmans, 2017).
When the study was set up in the spring of 2020, mass testing in testing centres was not possible yet. Therefore in selecting the locations for the study, the emphasis was on finding matches between GPs’ territories and the sewer system. Both are different from the districts and neighbourhoods used by the Dutch Central Statistics Bureau (CBS), making the choice of locations somewhat laborious. In the end, three areas in Rotterdam-Rijnmond were selected, namely Rozenburg, Ommoord and Katendrecht. In order to obtain insight into the effect of scale on the results of the study, we also selected larger areas. At the beginning of 2021, Bergschenhoek was added in view of large-scale investigation of the emergence of the Alpha variant in this location (van Beek et.al., 2022).
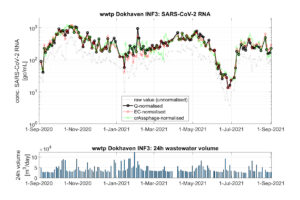
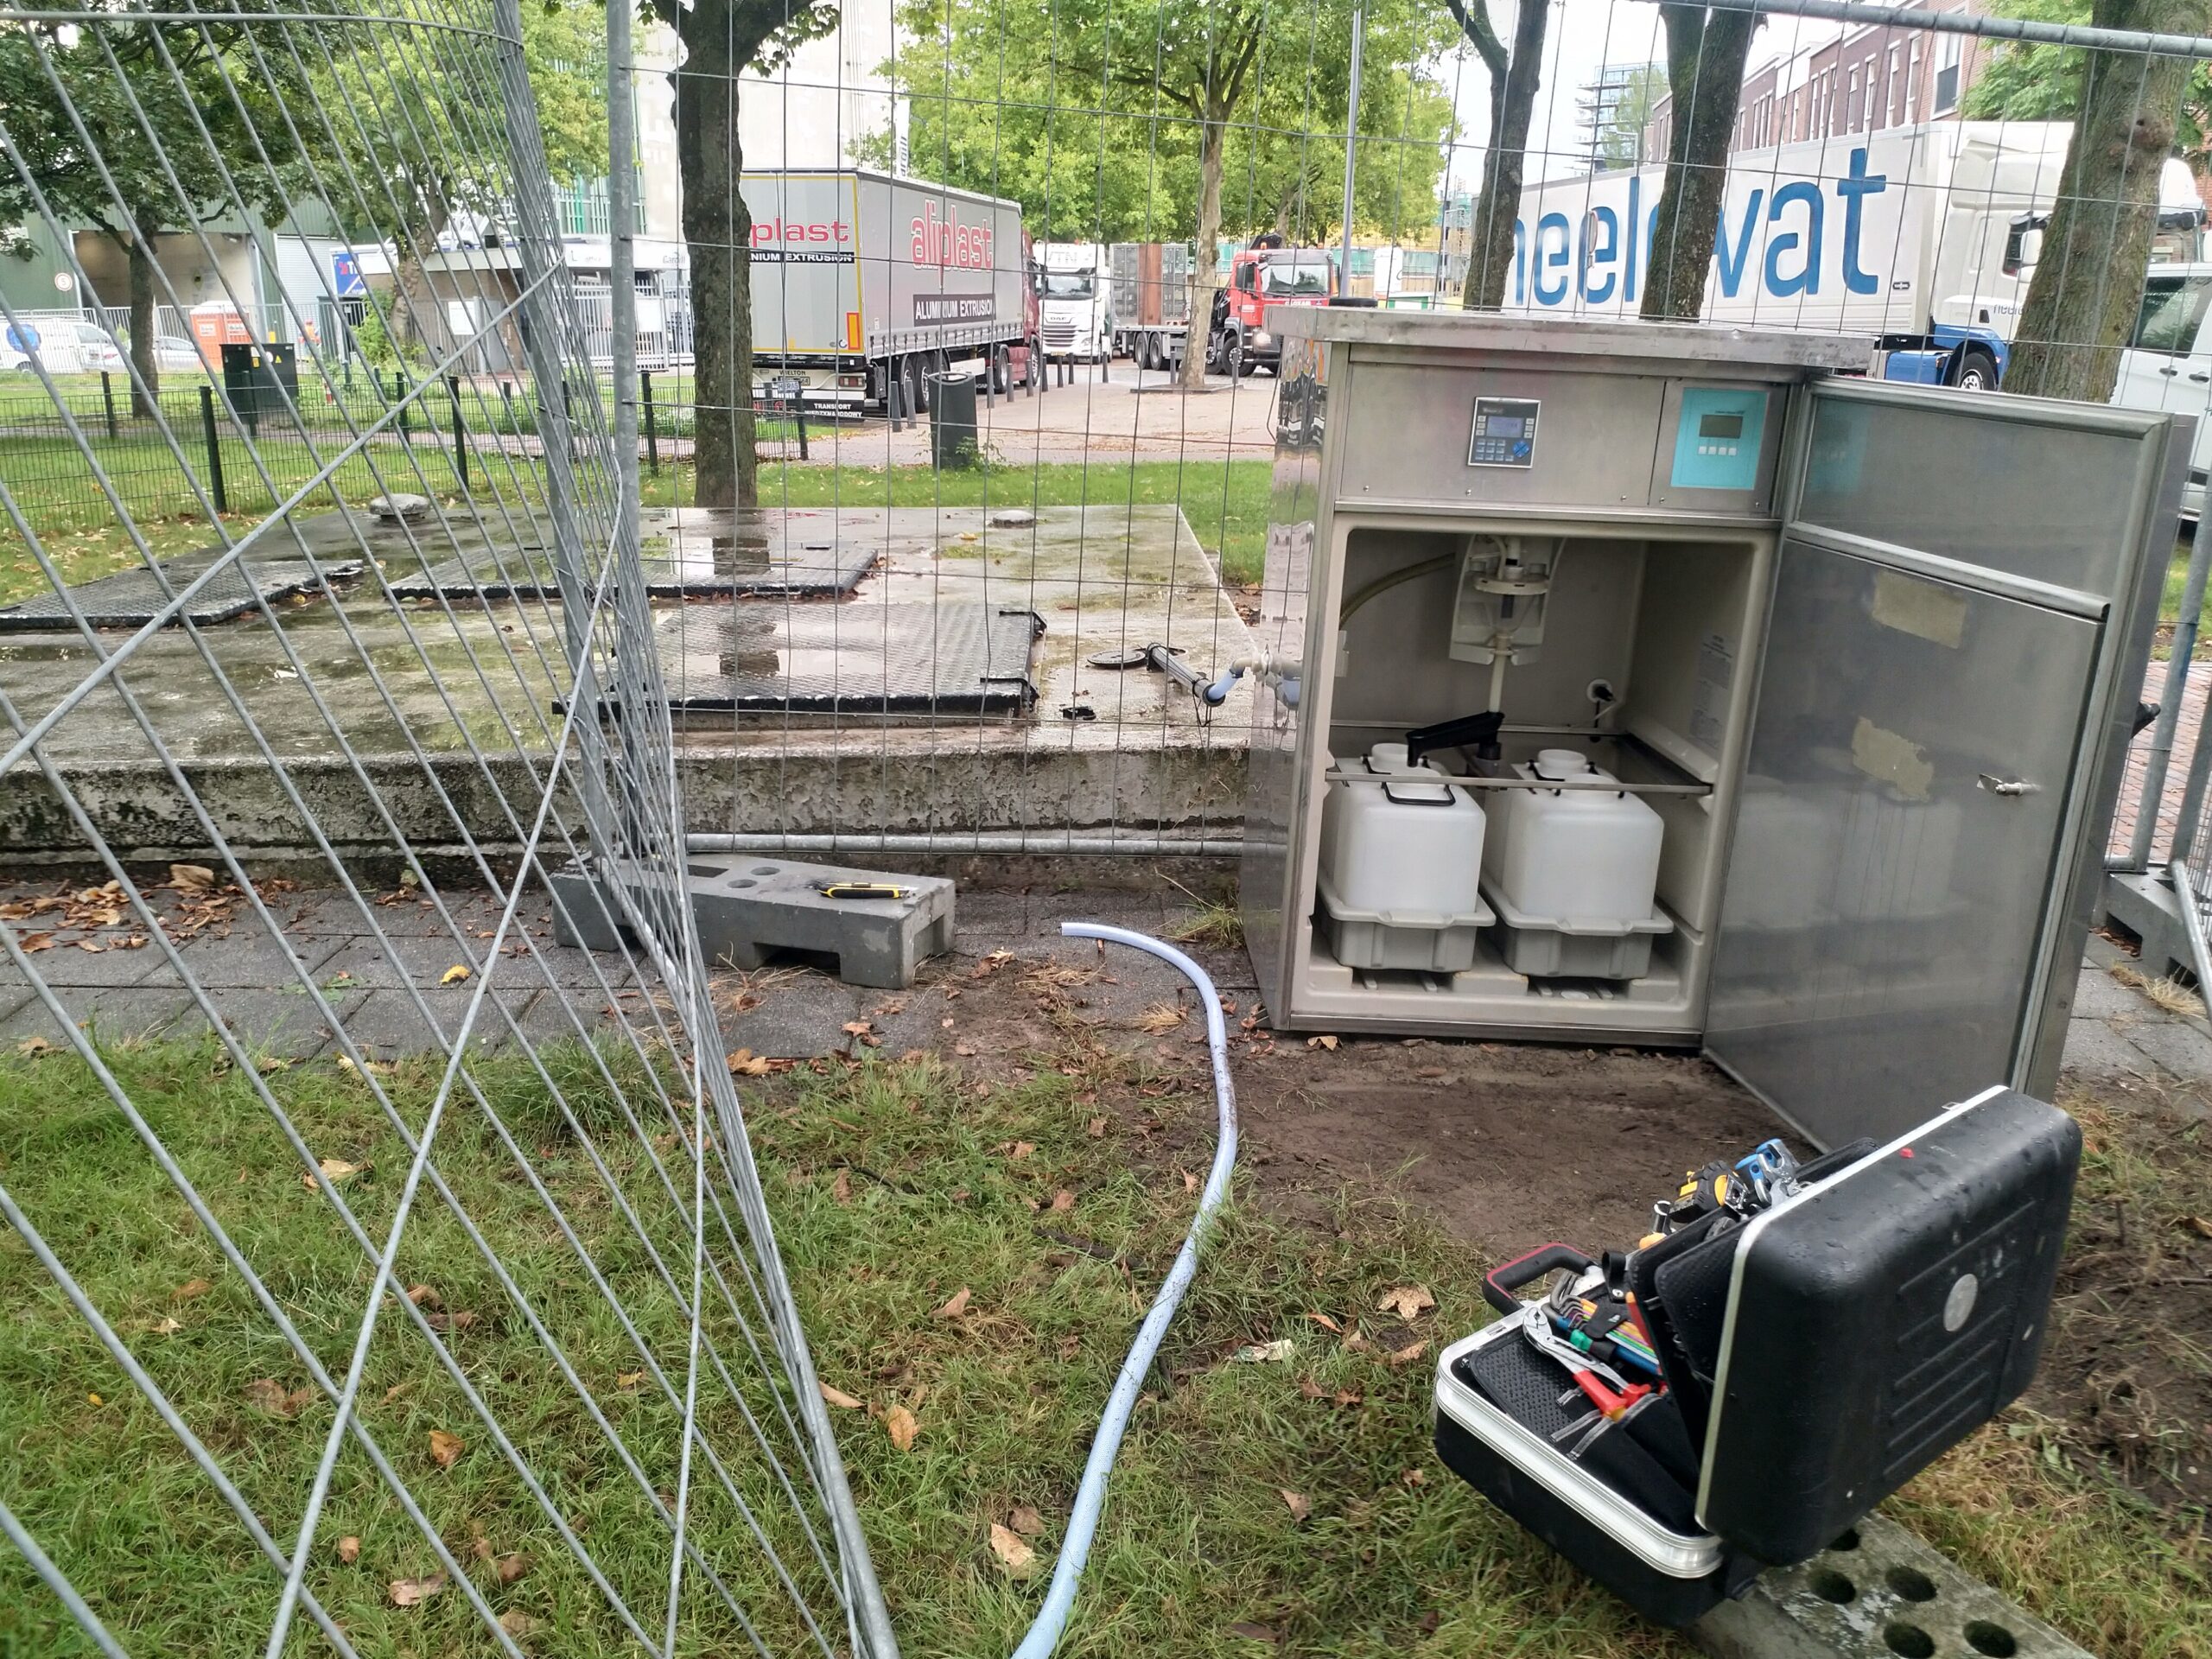
Figure 2. Sampling cabinet at the Katendrecht underground sewer pumping station. The equipment regularly adds a bit of sewage to a sampling vessel to get a representative 24-hour sample.
Quality assurance and normalisation
For reliable results, the sewage surveillance must meet the following conditions:
- The sewage at the sampling location is representative for the excretion of the virus throughout the population. The most important requirement in this regard is that faeces end up in the sewage. This is usually the case, although there are exceptions in the case of incontinence or when the call of nature is answered elsewhere.
- The population is more or less constant. This is not the case for tourist areas, for example. In Rotterdam, the opposite applies: in the 2021 summer vacation period, the number of people fell by between 10 and 15 percent.
- The sample is representative for the sewage at the sampling location. During transport through the sewers, the virus load is exposed to all kinds of influences, such as discharge via a combined sewer overflow. Defective pumps or sewer pipes with long residence times can also lead to the sample on day X not being representative for the excretion on that day.
- Discharge measurement is sufficiently reliable. This can be achieved by means of good control of the measuring arrangements and ongoing data validation.
- The laboratory analysis is sufficiently reliable. Strict quality controls and double checking make this condition readily attainable too.
In the ‘Rotterdam-Rijnmond sewage surveillance’ research project, much attention was given to sampling, laboratory analysis and normalisation routines for keeping watch on the representativeness of the population’s faeces and of the results of the analysis. Normalisation involves defining the degree of dilution of household wastewater with other sorts of wastewater such as rainwater, non-sanitary wastewater and industrial wastewater. The use of different methods of normalisation alongside each other is important in this context. A difference in methods can point to a non-representative or less representative sample as a result of technical problems with pumps, combined sewer overflows or incorrect assumptions about the number of people ‘taking part’ in the virus excretion.
The normalisation methods researched and applied weekly are:
- Normalisation on the basis of discharge: throughput measurements can determine the share of household wastewater in the sample and so take account of its dilution with industrial wastewater, non-sanitary wastewater and rainfall run-off.
- Normalisation on the basis of conductivity: electrical conductivity is a good measure of the dilution of a sewage sample with rainfall run-off.
- Normalisation on the basis of crAssphage: crAssphage is a virus that infects bacteria in the human gut, and that therefore follows the same route through sewage as SARS-CoV-2 virus particles. Providing the population’s excretion is stable, this makes crAssphage theoretically very suitable as a normaliser for the number of ‘excretors’ from whom faeces have arrived in the sewage system on the day of sampling.
Figure 3 shows an example of the effect of normalisation. Particularly on rainy days, a sharp correction needs to be made for the share of household wastewater in the sample. By maintaining the three normalisation methods in parallel, it proved possible to rectify non-representative samples due to prolonged pump malfunction, or mistakes in sample taking or inadequate specimens in the laboratory method due to inhibitions, for example.
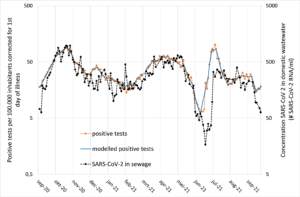
Figure 3. Normalisation of SARS-CoV-2 measurements in sewage of area INF3, see figure 4 for the period September-December 2020 (Langeveld et al., 2021)
Trend analysis
Comparing the trends in the various layers of the surveillance pyramid provides an insight into the development of the pandemic. Figure 4 gives an example of this comparison. The trend in the number of positive tests is broadly in line with the trend in the normalised measurements of sewage. At several moments, it can be seen that the sewage signal is more objective, because it is independent of test behaviour.
From mid-December 2020 anyone who so wished could be tested, and many people made use of this in order to be sure of being safe for the upcoming holiday period. This gave the impression of a new surge in the circulation of the virus, whereas the sewage data showed that there was no increase at all.
In mid-February, snowfall brought slippery conditions underfoot. This was one possible reason why the number of positive tests decreased, which again was not visible in the sewage data.
The third interesting moment was the ‘dansen met Jansen’ spike: young people were given access to nightlife after one vaccination with no waiting period, coupled with ‘testing before access’. This led to a huge spike in the number of positive tests among young people who, until then, had generally not had themselves tested in large numbers, while the spike as seen in the sewage was much lower.
The conclusion is that differences between numbers of positive tests and sewage data are caused by changes in testing behaviour. To verify this, we made a statistical calculation model with which the number of positive tests is calculated as a function of the concentration of virus particles in the sewage and testing behaviour. This calculation model is very capable of calculating the number of positive tests during the whole period including the new variants such as the Alpha and Delta variants. The Omicron variant, which is associated with reduced excretion, made it necessary to correct for this reduced output in the model.
The trend analysis of the sewage data and particularly the statistical modelling have proved to be powerful tools helping to monitor the pandemic and signal changes in testing and their behaviour of the population and the virus itself.
Conclusion
This large-scale and long-lasting study has shown that sewage surveillance is a mature method enabling the health authorities to monitor disease that circulate in society and end up in sewage via excretion. For COVID-19 the added value has been proven and recently there have also been positive experiences with the monkey pox virus.
SUMMARY
Sewage has proven to be an important and reliable source of information on public health in the past few years. A large-scale and long-term study in Rotterdam-Rijnmond has shown that sewage surveillance is a mature method enabling the authorities to monitor the spread of diseases that end up in the sewage via excretion. It was evident from the sewage data that in the case of a number of spikes in positive tests in testing centres, it was not that the number of infected people had suddenly shot up but rather that many people had gone to the testing centre.
References
Nieuwenhuijse, D.F. & Koopmans, M.P. (2017) Metagenomic sequencing for surveillance of food-and waterborne viral diseases. Frontiers in Microbiology, 8, 230.
Miranda de Graaf et al. (2002) Capturing the SARS-CoV-2 infection pyramid within the municipality of Rotterdam using longitudinal sewage surveillance. medRxiv 2022.06.27.22276938
Janko van Beek et al. (2022) Population-based screening in a municipality after a primary school outbreak of the SARS-CoV-2 Alpha variant, the Netherlands, December 2020 – February 2021. Plos-one 17 (10)
Jeroen Langeveld et al. (2021). Normalisation of SARS-CoV-2 concentrations in wastewater: the use of flow, conductivity and CrAssphage. medRxiv 2021.11.30.21266889
Featured image: Sampling cabinet at the Katendrecht underground sewage pumping station. The equipment adds some sewage water to a sampling vessel at regular intervals to get a representative 24-hour sample.


