In order to reduce nutrient losses from agricultural fields to ground- and surfacewater, the low-hanging fruit has long ago been picked. To support an effective spatially targeted approach, an innovative, intensive monitoring method was set up in two areas: the catchment areas of the Vuursteentocht (Flevopolder, clay soil) and of the Vinkenloop (North Brabant, sandy soil). What new knowledge does this provide and what action perspectives does it open up for a further spatially targeted approach to nutrient losses?
In order to comply with the Nitrates Directive and WFD targets for ground and surface water, inputs of nitrogen and phosphorus to groundwater and surface water must be further reduced. In addition to generic rules for manure policy, the national government is committed to a spatially targeted approach. Many measures can be used for this purpose, but which ones and where are they applicable and effective?
Area-based approach
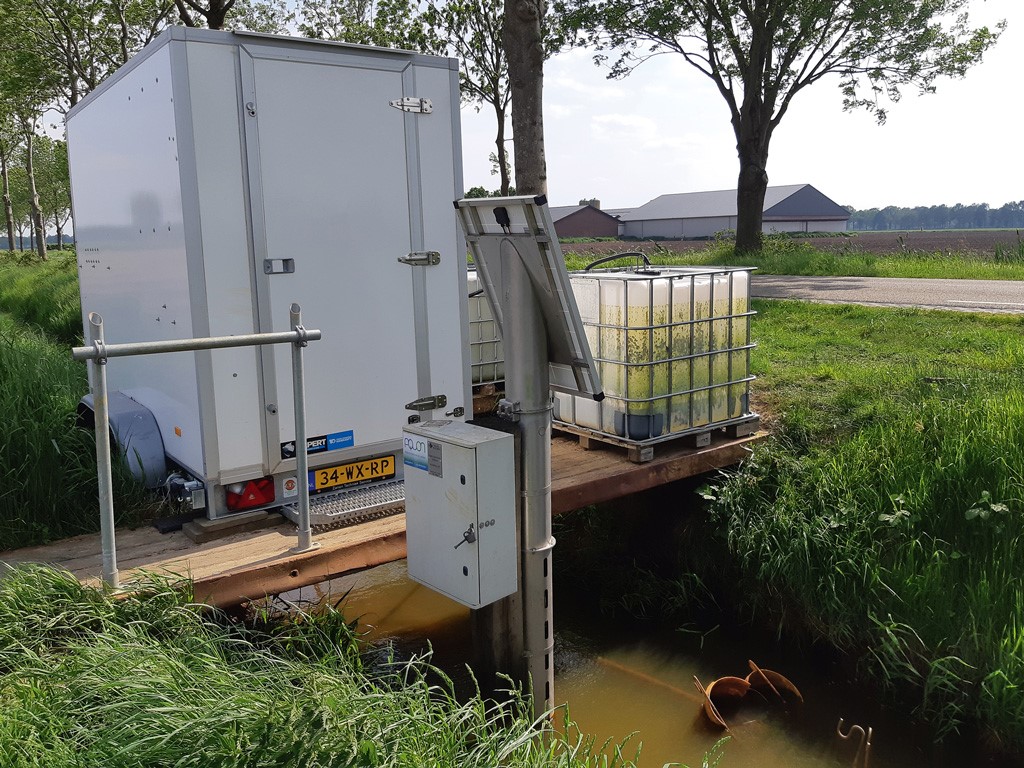
To find effective measures for this approach, the research programme of the Water Quality Knowledge Impulse set up an intensive and innovative monitoring network in two catchments (Vinkenloop and Vuursteentocht, 7 and 13 km2). The monitoring network is intended to provide a better understanding of the sources and routes of nutrient flows. Where are hotspots, and when and why do hot moments occur? How does the soil and water system function, how are nutrient losses related to weather, fertiliser application and land use? The study is also intended to demonstrate the added value of combining different measurement techniques.
The monitoring has been operational since the end of 2020. This was followed by a year and a half of measuring and subsequent modelling.
Plot and catchment scale monitoring
Different measuring techniques have been combined to monitor at both catchment and plot scale. Sensors were deployed at various locations to detect hot moments and hotspots of nitrogen and phosphorus flows. In addition, manual measurements were taken to identify spatial patterns, with underlying sources and processes. The table gives an overview of the monitoring techniques and of the points for attention and results that they produced.

Table 1. Evaluation of monitoring results at catchment area level
Routings
With a routing, the concentrations and other parameters in the ditches and larger watercourses are measured on one day, so that a spatial picture emerges. Use is made of sensors and a nitrate app attached to a canoe or fishing rod. In both areas (Vinkenloop and Vuursteentocht), the temperature, conductivity and nitrate concentrations were measured at five different times. This provided a relatively cheap picture of the main routes and hotspots for nitrate leaching in the areas.
In the Vinkenloop, it was repeatedly found that the highest nitrate concentrations (approx. 30 mg/l NO3-N) came from a lily field; in spring this was even the only source of nitrate in the catchment area. Around the Vuursteentocht, nitrate was transported to the canals via the drains and ditches at concentrations of around 8 mg/l NO3-N, with some peaks of around 20 mg/l NO3-N. No nitrate was found in surface run-off, but in the leachate from uncovered manure piles the concentration was above 50 mg/l NO3-N.
The temperature measurements from the routings show which ditches are fed mainly from the shallow groundwater (relatively cold) and which ditches are fed more from the deep groundwater (relatively warm). See Figure 1 for the situation in the Vinkenloop area.

Figure 1. Results of routings February 2022. On the left the temperature (difference from reference (˚C) and on the right nitrate concentrations. This provides a picture of where relatively high levels of seepage occur (left, orange-coloured ditches and streams) and areas where high nitrate leaching occurs (right).
Depth profiles of nitrate concentrations
Sampling from two crop plots in the Vinkenloop (lilies and chicory, Figure 2) shows that the top metre of groundwater at both locations is high in nitrate, and that concentrations decrease with depth. At one measuring point, the groundwater is nitrate-free from a depth of 5 metres, whereas at another measuring point it is nitrate-free from a depth of 3-4 metres. The differences between the measuring points are caused both by the type of cultivation and by differences in denitrification (conversion of nitrate into harmless nitrogen gas) due to the presence of organic matter. The dampening effect of denitrification on the leaching of nitrate is also visible in relatively low nitrate concentrations in the drains.
The depth profiles also indicate that the ammonium concentration in the deeper groundwater is not directly related to fertilisation. It is likely that this ammonium is released through mineralisation of organic matter or through conversion of nitrate during soil passages. Isotope analyses in groundwater and surface water indicate that discharge of deep groundwater containing ammonium is largely responsible for the background concentration of ammonium in the Vinkenloop. Continuous measurements of ammonium at the outflow point confirm this picture.

Figure 2. Nitrate depth profiles at different times under the lily plot and the adjacent chicory plot. The nitrate standard of 50 mg/L is shown with a vertical dotted line.
Data-driven modelling
Various data-driven modelling techniques were used to process and interpret the measurement data, for example to check measurement data from high-frequency monitoring and to fill in gaps in measurement series. The relationships found in these models between hydrology and water quality are also useful for extrapolating measurement series to other weather years, and for roughly estimating the effect on concentrations at the outflow point when dust loads change in the emission pathways. The results of these data-driven models can also be used for input and validation of dynamic process models.
Process models are needed to quantify the origin of nutrients in water leaching from fields and the effects of agricultural measures. For both pilot areas, a first version of detailed process modelling was set up with the calculation codes of SWAP and ANIMO. These simulate the crop uptake of moisture and nutrients and the moisture and nutrient balance in the soils, including run-off into groundwater and surface water. The concept of the process model, after reducing the maximum flow depth and lowering shallow resistances, fits well with the measurements.
Conclusions
The results of the measurements, together with the different models, provide a clear picture of
- how the soil and water system functions,
- how the nutrient fluxes react to weather (precipitation), manure application and land use,
- where hotspots are and when and why hot moments occur.
The insights gained confirm the expectations from previous research for the catchment and field level, and provide experimental justification and quantification.
The monitoring also provides new insights. The most important are listed below:
- Nitrate leaching occurs more quickly after a rainy period than expected from older modelling studies.
- Ammonium in groundwater is a determining factor for background concentrations in surface waters in both pilot areas.
- In the Vuursteentocht pilot area, seepage water only drains to the deeper canals and not to the drains and ditches;
- The routes to the drains and ditches (the groundwater flow patterns) are shallower than always assumed in previous modelling studies.
- In the Vinkenloop, a transition from oxidised groundwater with high nitrate concentrations to anoxic groundwater without nitrate was observed at relatively shallow depths. Water flowing through the reduced zone to drains and ditches has a lower nitrate concentration than water flowing shallowly to the drains.
This provides guidance for finding applicable and effective measures.
The combination of measurement and modelling provides better information than the mere collection of measurement data or the mere application of models. With models, measurement data can be better interpreted and, conversely, the measurements contribute to greater model reliability. As it is not feasible to set up such an intensive area-based monitoring in all problem areas, building blocks from the Delta Fact ‘Guide to area-based monitoring of nutrient losses from agriculture’ may help to determine which monitoring strategy is appropriate for the area.
It is strongly recommended to continue monitoring in both pilot areas over a long period of time, preferably permanently. It will then remain an ideal testing ground for new measuring techniques, for the testing of models and for deriving effects of agricultural measures in a real field situation.
Peter Schipper, Piet Groenendijk (Wageningen Environmental Research), Saskia Lukacs (National Institute for Public Health and the Environment (RIVM)), Arnaut van Loon (KWR Water Research Institute) and Joachim Rozemeijer (Deltares)
Sources
- Knoben, R.N. Evers, A. Jacks, J. Rost, N. Schoffelen, M. de Haan, B. van Spronsen, F.L. Verhagen, H. Evenblij and B. van Velthoven, 2021. ‘Ex Ante Analysis of Water Quality‘ . Report Royal Haskoning DHV 28-9-2021.
- Introductory dossier for members of the Ministry of Agriculture, Nature and Food Quality (2022), Rijksoverheid.nl
- Parliamentary letter 7th action programme Nitrate Directive, Parliamentary paper 26-11-21, Rijksoverheid.nl
- Schipper, P. Groenendijk, L. van Gerven, A. van Loon, S. Lukács, J. Rozemeijer 2022. Monitoring and modelling in two pilot areas for area-based approaches’. STOWA (KIWK) report 2022-22.


