
Please note that this article was previously published in H2O’s Water matters
Summary
The influents and effluents from seven wastewater treatment plants were monitored for a year, as well as the quality of the surface water in the receiving water bodies. The collected data were compared with the model calculations of the HSA. The data were also used to estimate the ecological impact of effluent discharges by comparing them with the available predicted no-effect concentration (PNEC) for several pharmaceuticals. The impact on the downstream intake for drinking water production has been estimated by comparing the data with the signal value for drinking water production.
In general, the measured concentrations appear to be slightly lower than those previously calculated in the HSA. This overestimation by the HSA can be explained by the basic assumptions used. The measured concentrations also indicate several major changes in the HSA ranking, with several wastewater treatment plants performing better than expected. When the number of PNEC exceedances is used to compile a ranking, this ranking appears to correspond to the new ranking based on the measured loads. If the impact on drinking water production is estimated on the basis of the signal values, the wastewater treatment plant effluents for the same five substances appear to exceed this signal value.
Introduction
A measurement campaign, designed to determine the impact of pharmaceuticals discharged from seven wastewater treatment plants, provides the opportunity to ascertain whether the correct wastewater treatment plants have been designated as hot spots. In general, the measured concentrations appear to be slightly lower than previously calculated in the Hot Spot Analysis (HSA).
Many surface waters in the Netherlands contain traces of micro-pollutants: pharmaceutical residues, plant protection agents, household chemicals and industrial contaminants (Moermond et al, 2016). These substances are in low concentrations, varying from a few nano- to micrograms per litre. Although the concentrations are low, there is growing evidence that these substances negatively impact the aquatic environment (STOWA 2014-44).
A large portion of the micro-pollutants in surface water is directly related to effluent discharges from wastewater treatment plants (Moermond et al, 2016). For a better idea of this relationship, the HotspotAnalyse Geneesmiddelen RWZI’s or ‘Hot Spot Analysis of Pharmaceuticals from Wastewater Treatment Plants’ (STOWA 2017-42), hereinafter referred to as the ‘HSA’, was conducted in the Netherlands.
This analysis was based on the average removal efficiency – identically estimated for all of the wastewater treatment plants with the same method – for the pharmaceutical residues. The input for the calculations was the total load of a specific group of pharmaceutical residues derived from the measurements taken for previous studies. The pharmaceutical load of the influent was calculated on the basis of the estimated excretion per connected population unit. The concentrations in the effluent and surface water were subsequently calculated on the basis of a mass balance. The study resulted in a national ranking of wastewater treatment plants according to several indicators.
Several studies show that the removal efficiencies for pharmaceuticals vary from 0 to 99%. The efficiency here depends in part on specific substance properties. In addition, it is now known that the removal efficiency of wastewater treatment plants varies greatly (such as Watson database, Maas et al., 2017, Wubbels et al., 2018, in comparison with STOWA 2018-02, STOWA 2018-46).
The HSA ranking does not take into account the ecological impact of the discharged pharmaceuticals, but rather only the quantity: the greater the discharged load compared to the diluting capacity of the receiving water, the higher the final concentrations (and, therefore, the higher the ranking position). This article describes the results of follow-up research, whereby the current removal efficiencies and surface water concentrations, as well as the ecotoxicological relevance have been included in the analysis. This information allows us to determine whether the correct wastewater treatment plants were designated as hot spots in order for them to be prioritised for purification efficiency improvements.
This article is the first of two that deal with micro-pollutant measurements in influent, effluent and surface water, and how the results can be used to further develop the HSA Geneesmiddelen (HSA of pharmaceuticals). This article describes a measurement campaign that was designed to determine the impact of pharmaceuticals discharged from seven wastewater treatment plants.
Sample collection
We carried out the measurement campaign in the management area of the Aa and Maas Water Authority. The focus of the campaign was the relationship between the effluent discharge and the receiving surface water. For a total of twelve months (2017/2018), a monthly sample of influent and effluent was collected from each of the seven wastewater treatment plants, as well as upstream and downstream of the effluent discharge point in the surface water. The samples were then analysed for twenty-seven different pharmaceutical residues (see Annex Table 1). The analyses were performed by the Aquon Laboratory (Schoffelen et al, 2018).
Table 1. Pharmaceuticals analysed
| amidotrizoic acid | bezafibrate | carbamazepine |
| ciprofloxacin | clarithromycin | clindamycin |
| clozapine | (diaminomethylidene)urea | diclofenac |
| dimetridazole | phenazon (antipyrine) | gabapentin |
| hydrochlorothiazide | ibuprofen | irbesartan |
| jopamidol | ketoprofen | lidocaine |
| metformin | metoprolol | oxazepam |
| pentoxifylline | pipamperon | sotalol |
| sulfamethoxazole | trimethoprim | valsartan |
Comparison with the HSA
Based on the results, the sum was calculated for each sample of the nineteen pharmaceuticals used in the HSA. The measured concentrations in the receiving water bodies were compared with the values calculated for the HSA (see Table 2). The individual pharmaceutical concentrations were totalled for each month and averaged for the entire year.
Table 2. Comparison of model calculations from the HSA and concentrations measured downstream of wastewater treatment plants
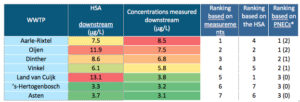
*Between parentheses, the numbers of substances whose PNEC (predicted no-effect concentration) was exceeded
With the exception of the Aarle-Rixtel location, these measured concentrations were lower than the calculated values from the HSA. This may be due to the fact that the HSA uses a median flow rate for the summer period. Particularly in the winter, greater dilution occurs, thereby reducing the average concentration.
The ranking that emerged from the data measured differs considerably from that of the HSA. The WWTP occupying the number one position in the HSA (Land van Cuijk Wastewater Treatment Plant) appears to score better based on the measurements; coming in at the fifth position in the new ranking. This shift is likely caused by the fact that the HSA does not include the effect of a downstream treatment phase.
According to the values measured, the Aarle-Rixtel Wastewater Treatment Plant, occupying the fourth position in the HSA, has the highest concentrations downstream. The distribution in the measured concentrations also appears to be lower than in the calculated concentrations: the highest measured value (8.5 µg/L) is 35% lower than the highest calculated HSA value (13.1 µg/L).
A closer look at the data shows that there are shifts in the relative contribution of individual substances. According to the HSA calculations, the highest pharmaceutical concentration in the surface water belongs to metformin. According to the measurements, the highest pharmaceutical concentration belongs to valsartan, while metformin occupies the fourth position (see Figure 1).
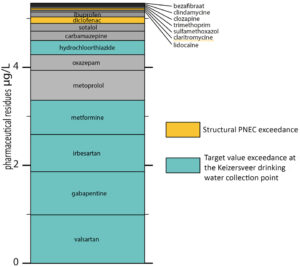
Figure 1. Pharmaceutical concentrations in surface water, downstream of wastewater treatment plants near the rivers Aa and Meuse (Maas in Dutch). The substances in yellow exceed the PNEC. The substances in blue exceed the signal value for intake at the Keizersveer production site.
Relationship with water quality of the surface water: PNECs
The total pharmaceutical load is not necessarily correlated with the toxicological impact of the discharge. Large differences per substance in the concentration-effect relationship can be expected; this is expressed, for example, with the PNEC.
Figure 1 presents the total pharmaceutical load in surface water downstream from the Aa and Maas Wastewater Treatment Plant. More than 50% of this total load consists of four substances with a relatively high concentration but with a low ecological impact, whereby the PNEC is not exceeded. Diclofenac (a painkiller), present in a much lower concentration, only occupies the tenth position in terms of load. However, the diclofenac concentration exceeds the PNEC, meaning that this substance has a toxicologically relevant impact.
The other substance that exceeds the PNEC, clarithromycin (an antibiotic), occupies the thirteenth position in terms of concentration. One or both PNECs were exceeded at four locations. It is striking that the ranking based on measured concentrations corresponds to the ranking involving the PNECs.
Relationship with drinking water production
Eventually, the effluents from all of the wastewater treatment plants included in the measurement campaign enter the river Meuse directly. Further downstream, this water is used for drinking water production. Drinking water producers do observe a signal value for micro-pollutants, such as pharmaceutical residues. Once this is exceeded, vigilance is required.
Depending on the nature of the substance, it may be necessary to stop the water intake. At all of the locations, the concentrations for five substances measured downstream of the wastewater treatment plant were higher than this signal value. This involved the following substances: valsartan, gabapentin, irbesartan, metformin and hydrochlorothiazide (see Figure 1).
Conclusions and looking ahead
- The measurements of pharmaceuticals in surface water provide valuable information that can be used to further elaborate the HSA. The measurement campaign we carried out on seven wastewater treatment plants demonstrates that the downstream concentrations have been generally overestimated in the HSA.
- The values measured result in a different ranking of wastewater treatment plants than the ranking from the values calculated in the HSA. The conclusion from this is that prioritisation of the locations where additional pharmaceuticals should be removed must also be based on measured values and not solely on calculated values.
- The HSA ranking also changes when the ecological impact is taken into account using the PNECs. This ranking corresponds to the ranking based on the loads measured.
- Taking into account the signal values for drinking water production also results in a change in the ranking. The signal values for five substances were exceeded for all of the locations covered by the measurement campaign.
The next article utilises the data from the measurement campaign to determine the removal efficiencies for each wastewater treatment plant. This data, therefore, has been supplemented by a measurement campaign carried out on eighteen wastewater treatment plants in the east of the Netherlands, in the Rhine-East area. This measurement campaign focused on explaining the differences in the removal efficiency for each wastewater treatment plant.
References
- Maas, P. van der; B. Bult; H. de Vries; O. Kluiving; 2017; Verwijdering van acesulfaam in rioolwaterzuiveringsinstallaties: wat bepaalt het verschil?, H2O, 17 July 2017
- Moermond, C. et al, Geneesmiddelen en waterkwaliteit, RIVM, 2016-0111
- Wubbels et al. Biologische fingerprinting biedt inzicht in verwijdering van medicijnen en zoetstoffen in rwzi’s, see here
- STOWA 2017-42 Landelijke Hotspotanalyse geneesmiddelen RWZI’s
- STOWA 2018-46 Zoetewaterfabriek awzi de Groot Lucht: pilotonderzoek ozonisatie en zandfiltratie
- STOWA 2018-02 PACAS – Poederkooldosering in actiefslib voor verwijdering van microverontreinigingen
- Watson database in de emissieregistratie; http://www.emissieregistratie.nl/erpubliek/erpub/wsn/default.aspx


