
Please note that this article was previously published in H2O’s Water matters
Summary
Knowledge of the soil moisture content is of key importance to water managers in order to anticipate extremely wet and dry conditions. OWASIS aims to provide this knowledge by supplying historical and forecasted time series of soil moisture content, storage capacity and shallow (phreatic) groundwater levels. OWASIS combines satellite and radar based observations with water system data in a hydrological model, yielding operational data streams on a national scale. Test users state the product is a valuable addition to their daily operations, and recommend further improvements for the data and their applications.
Introduction
OWASIS aims to provide operational water managers with insight into the available soil moisture, as well as the storage capacity and the shallow (phreatic) groundwater level. The test users’ assessment was that the concept was useful in practice, but that seeking out improvements would be worthwhile.
Water level management revolves around controlling surface and groundwater levels and controlling the water balance. Too much or too little water translates into nuisance or damage for users. Anticipation is crucial to being able to cope with extremes. To that end, water managers monitor surface and groundwater levels and, of course, keep a close eye on the weather forecast.
An important, but unknown, parameter is the moisture content of the soil. How much moisture is available for plants? And, alternatively, how much water can be stored here temporarily in case of hard showers? OWASIS aims to provide the operational water manager with insight into this as yet missing information.
In the event of flooding and water shortages, it is important for water managers to know both the current and expected saturation rate of the soil in their entire management area. In this way, the soil reservoir can be better used to either temporarily store water or to retain the available water in a timely manner. In this article, we explain the concept of OWASIS and demonstrate the initial insights gained from applying OWASIS to the practices of water management.
Concept and elaboration
The soil moisture content, the amount of water in the uppermost 1 – 1.5 metres of the soil, determine the growing conditions for plants and crops. In-situ monitoring of soil moisture is expensive and difficult to implement due to the heterogeneity of the soil, meaning that measurements only contain information from the environment directly around the sensor. For this reason, the conditions for nature and agriculture have traditionally been indirectly evaluated on the basis of groundwater level measurements and statistics derived from them, such as the GHG and GLG (the average highest and lowest groundwater levels; respectively. For more information, see the following website: http://edepot.wur.nl/163486).
With the arrival of advanced models, radar hydrology and satellite observations, the time is ripe to base more and more water management decisions directly on soil moisture information. The OWASIS system was developed according to this idea. The reason for this was a heavy precipitation event in October 2013 in the management area of De Stichtse Rijnlanden Water Board. At the end of the summer, the groundwater levels were low and the soil appeared to offer ample space to store the precipitation. Pre-milling or other precautions to prevent flooding proved unnecessary.
At the time, the technology to monitor soil moisture using satellites was not sufficiently developed for operational use. However, technology for deriving the actual evaporation was sufficiently far along. Since 2013, the evolution from evaporation to soil moisture has evolved into the current OWASIS through several studies. The figure below illustrates the essential components of OWASIS.

Figure 1: The diagram explains flow of information from one component to the other.
OWASIS combines various existing data sources into several new information flows. Central to this is the hydrological model, LHM (see NHI.nu for more information about the LHM), which combines meteorological input (based on radar, weather forecasts and satellite-based actual evaporation) with calculation rules on the flow of water in the subsurface and the unsaturated zone and with system knowledge (soil, ground level, location of watercourses, etc.) to estimate the soil moisture conditions, storage capacity and phreatic groundwater levels. This model calculates the requested output variables in time intervals of one day per grid cell measuring 250×250 metres.
Each night, a new and updated condition and forecast is calculated for the coming days based on observations made up to midnight. This allows water managers to have a ‘fresh’ impression at their disposal every morning on which to base decisions for that day.
Relevance for the practice
As part of the development, the calculated soil moisture and groundwater series have been validated using soil moisture measurements from the catchment area of the river Raam (in North Brabant) and groundwater level measurements within the management area of De Stichtse Rijnlanden Water Board. The standard LHM uses interpolated precipitation and evaporation data from the KNMI ground stations. For the first improvement, the precipitation data was replaced by calibrated precipitation radar images. This means that far more variation is included in the precipitation. In the second improvement, the evaporation data was ‘replaced’ (using a simple form of data assimilation) with the actual evaporation based on satellite images.
A mixed picture emerges from these comparisons. The groundwater levels were reasonably described by the original model, with r2 values of 0.5 – 0.9 (an average of 0.75). (The coefficient of determination r2 is a statistical measure that provides information about the extent to which a model approaches reality. The value can vary between 0 (no agreement) and 1 (complete agreement). Adjusting the input resulted in limited improvement in the performance of the model. A much larger improvement was observed for the soil moisture: the average r2 value for the sixteen locations increased from 0.6 to 0.8 as a result of the adjusted input. This gave the test users confidence in this phase of the project that the relatively coarse gridded LHM also provides a good basis for this new information flow, provided that this model is fed with detailed precipitation and evaporation data.
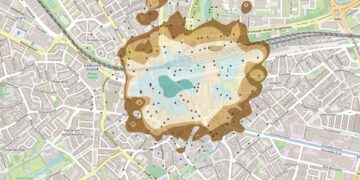
The dry summer of 2018 appeared to be a good test case for OWASIS. After the very dry and warm months of July and August, substantial precipitation fell in the western half of the Netherlands on 05 September within a short amount of time. Around 150 mm of precipitation fell in and around Bodegraven in eight hours, with peaks above 170 mm. The precipitation event was severe but localised: in Moordrecht, about 12 km to the south, only about 25 mm fell on that day. The effect on groundwater levels and the available soil retention was immediately visible: the calculated available soil retention in Bodegraven fell from 134 mm to 93 mm in one day, with a ‘normal’ September average of 30 to 40 mm. Note that the model, therefore, also takes into account that portion of the precipitation during such an intense shower that does not infiltrate into the soil, but flows superficially into surface water or the sewage.
De Stichtse Rijnlanden Water Board used OWASIS in the autumn of 2018 to determine the transition from the summer to the winter level. This eventually took place just prior to Christmas. In the winter of 2019, De Stichtse Rijnlanden Water Board implemented the OWASIS information flows in the VIDENTE decision support system. Within VIDENTE, OWASIS is used in order to follow whether we are heading back to a dry situation like last year, or whether it might be necessary to anticipate flooding.
Discussion
Satellites are capable of observing the atmosphere and the earth’s surface with an ever-increasing level of detail, including the uppermost centimetres of the soil. OWASIS combines evaporation data obtained in this way with a hydrological model for soil moisture data for the entire soil column. It is also possible to derive estimates of the soil moisture from satellite observations. Because these direct observations only pertain to the uppermost centimetres of the soil, combining them with a hydrological model is a necessity to obtain estimates for the entire soil column.
We expect that this combination can be further improved to enhance the accuracy and resolution of the estimates for the soil moisture and groundwater. Besides the aforementioned satellite-based soil moisture measurements, online measurements of the phreatic groundwater level are also a good source for additional substantive improvements to the OWASIS information product. By making use of the correct assimilation techniques (e.g. an ensemble Kalman filter), the accuracy can also be quantified.
At present, estimates of the current and expected moisture condition are generated on a daily basis. This temporal resolution can be increased by generating expectations several times daily. In particular, this has added value when the weather models are able to accurately predict heavy summer showers. The KNMI is constantly researching this in the context of improving the HARMONIE (HIRLAM ALADIN Research on Mesoscale Operational NWP in Euromed) model.
The combination of a model with satellite data — including weather forecasts — is very powerful because it provides us not only with soil moisture information for NOW, but also about the hydrological conditions of tomorrow, the day after tomorrow, etcetera. Given that OWASIS is a country-wide system, we use this information to create perspectives for action for all water managers in the Netherlands, allowing water boards to better anticipate wet and/or dry conditions within their management area as well as in a more supra-regional context, such as Smart Water Management; in consultation with the surrounding water boards and the Directorate-General for Public Works and Water Management.
The development of OWASIS from a practical idea into a national information product is an example of an innovation envisaged by STOWA with the SAT-WATER programme: the application of information based on satellite data combined with existing knowledge and tools to advance existing water management a step further. A strong, practice-oriented development path was followed in a number of steps and with the financial support of the European Space Agency (ESA).
Nevertheless, the question remains whether an innovation like this will find its way into operational water management. This ‘valorisation’ of OWASIS depends on the added value within the working process of the hydrologist and water level manager when making decisions in the event of water shortages and imminent flooding. The experiences at De Stichtse Rijnlanden Water Board can certainly be called good. Not only was OWASIS used last year to (partially) determine the moment of transition from the summer to the winter level, but OWASIS was also embedded in VIDENTE 0.1, an HDSR BOS (decision-making support) system.
The availability of the input data required for OWASIS is guaranteed via the Water Board Headquarters (Waterschapshuis). The WIWB (wiwb.nl) project and SATDATA 3.0 project regulate the availability of basic, precipitation and evaporation data and weather forecasts, covering the entire country and cross-border, as open data. The Smart Water Management Programme of Directorate-General for Public Works and Water Management and the water boards will provide OWASIS with data for all Dutch water managers as from this summer.

