
Please note that this article was previously published in H2O’s Water matters
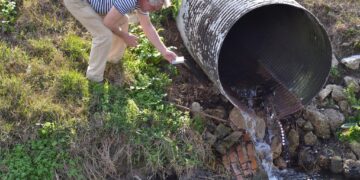
Photo courtesy: Rascope
Summary
Experiences from Germany and Switzerland are used in the implementation of measures for extensive removal of organic micro-pollutants from sewage. It regularly transpires that a key figure from abroad cannot simply be applied to the Dutch situation. This article presents the key figures on engineering and technology, costs and sustainability from the German-language literature and compares them with the Dutch key figures. This shows that these key figures have no universal validity, they require translation. The authors therefore call on everyone to find out for themselves what the best choice of technology is, based on the specific local situations at the wastewater treatment plants, and what the related costs and carbon footprint would be.
Introduction
The implementation of measures for the advanced removal of organic micro-pollutants from sewage water draws on experiences in Germany and Switzerland, where they are already well advanced in this field. It regularly transpires that a key figure from abroad cannot simply be applied to the Dutch situation. Some studies compare apples and oranges. There is still much to learn.
Engineers love to know figures: what are the costs per cubic metre, what is the consumption in grams of powdered activated carbon or ozone per cubic metre, and what is the energy consumption in kWh and the CO2 emission per cubic metre or population equivalent? How do the investments relate to the operating costs? These key figures help us to project experiences gained elsewhere onto our own situation. It is a translation key and usually it works very well.
Specifically in the area of micro-pollutants, much practical information is exchanged between Switzerland, Germany and the Netherlands, although this is mainly one-way traffic towards the Netherlands. In recent years, we have seen a development in the various aspects of micro-pollutants, initially learning from the Swiss in particular and later also from the Germans. Initially, the need was mainly for technological experiences. The first thing was to determine which techniques work, and what the achievable removal efficiencies are. Then the focus shifted to engineering, with questions about the facilities to be built, such as capacities and related costs. Finally, more and more attention is being paid to the impact on the user’s sustainability ambitions, mainly expressed as a carbon footprint.
Approach
This article presents the key figures from the German literature and compares them with the Dutch key figures, as published in STOWA reports (see the reference list). We follow the order as outlined in the previous section: 1. Engineering and Technology; 2. Engineering and Costs and 3. Sustainability. Each time, we analyse where the differences come from and discuss the factors that determine the usefulness of the relevant key figures. For a number of key figures, a proposal is made as to how these can best be used in the Dutch situation and what the bandwidth is for the Dutch situation.
The sources for the German-language key figures are articles from German-language professional literature, the two Kompetenzzentren knowledge centres in Baden-Württemberg and Nord-Rhein Westfalen and the website of the Verband Schweizer Abwasser- und Gewässerschutzfachleute.
Oxidation and adsorption
Currently, there are mainly two technologies that are widely used for the removal of micro-pollutants: oxidation (usually with ozone), and adsorption (usually with activated carbon in powder form (PAC) or granular form (GAC). In this article, key figures of these technologies will be discussed.
In Switzerland and some German states, a removal efficiency of 80% over the entire wastewater treatment plant is targeted for a selection of guide substances. These guide substances are partly the same as the guide substances designated in the Netherlands, but not exactly the same. In addition, based on the guidelines from the Ministry of Infrastructure and the Environment, in the Netherlands we are aiming for a 70% removal efficiency. In the Netherlands, this 70% abatement must be achieved for 7 of 11 guide substances; the choice of guide substances is free for each sample taken. In Switzerland and Germany, the freedom of choice is much more limited. In general, the Swiss requirements and also the German directives are therefore stricter than the Dutch requirements. This is already an important difference that has to be taken into account when translating Swiss and German key figures.
Engineering and Technology
Table 1a lists the relevant technical and technological key figures. These determine how much ozone or activated carbon is required for the desired removal of micro-pollutants and thus the dosing capacity to be installed in kg ozone or PAC per hour.
Both ozone and PAC react with micro-pollutants, but also with other compounds present in the water like nitrite and organic macromolecules, such as humic acids. These organic macromolecules (often presented as DOC, dissolved organic carbon) are present at a concentration 1,000 to 100,000 times higher than micro-pollutants and almost entirely determine the necessary overdosing of ozone and PAC to subsequently tackle the micro-pollutants as well. For various reasons, the DOC content in Swiss wastewater appears to be significantly lower than in the Netherlands. In addition, its bandwidth is greater within the Netherlands. By expressing the dosage as grams of ozone or activated carbon per gram of DOC, this problem is overcome.
However, also when we look at the DOC-specific dosage, we see a significant difference: in Switzerland, up to 30% less ozone is dosed per gram of DOC than is necessary in the Dutch situation, according to Dutch research. This is probably caused by a different composition of the DOC, in addition to the already mentioned removal targets. Because of this higher dosage, the energy consumption and carbon footprint per cubic metre are higher in the Netherlands. Moreover, this also directly affects the formation of bromate during ozonisation. The formation of this undesirable product increases with higher ozone doses. For both PAC and GAC, a lower DOC concentration also has a positive impact on the dose rate and the GAC retention time, but the effect seems less pronounced than for ozone.
Table 1. Comparison of key figures for technology, costs and sustainability for extensive removal of pharmaceutical residues from wastewater.

1 Disposal efficiency of wastewater treatment plant effluent compared to influent including bypass of non-treated partial flow. 2 At contact time of 30 minutes. 3 Average mix for all of the Netherlands. 4Various renewable materials including wood, coconut shells and waste from MDF (STOWA 2020-19).
Engineering and costs
As an illustration, the differences between the Dutch and German key figures for costs are presented in Table 1. This immediately raises the question: why is it cheaper in Germany? Comparing cost figures is a tough job even within the Netherlands, let alone in an international context. It can go wrong in many ways. That is why, within the Innovation Programme on Micropollutants (IPMV), strict agreements have been made on the way in which costs are compared, namely within a predetermined fictitious case for a WWTP of 100,000 p.e.
When comparing construction costs, it comes down to matters such as the reserve count used, the construction method, the type of subsoil and safety facilities, which in turn are related to legal requirements and site-specific customer wishes, etc. Another important factor is where the system boundaries lie. All these factors determine the numerator of the cost per cubic metre.
Furthermore, it is important to check what exactly is included in the denominator of the key figure – which cubic metres are involved? It makes a difference whether the wastewater treatment plant under consideration is designed for dry weather flow or a higher capacity including (part of) the peak during rainy weather flow. In the IPMV, it was agreed that the costs should only be based on the actual volume treated. In foreign presentations of key figures, however, it is often decided to allocate the costs of post-treatment to the total flow rate (the treated and untreated parts together).
Finally, it appears that the allowance of investments and operational costs is very different, whereby in particular the calculation method for investment costs (depreciation method, interest rate) and maintenance costs, are very decisive. The translation of cost figures is therefore impossible without knowledge of the system used, depreciation periods, interest rates and assumptions for maintenance costs.
Sustainability
The most important measure of sustainability at the moment is the equivalent CO2 emission of the activity under consideration. Table 1 shows the most important key figures. This shows that the CO2 emission from electricity in Switzerland is significantly lower than in the Netherlands. This, of course, has to do with the method of generation. In contrast to the Swiss mix, the Dutch mix contains a very low proportion of green energy. The differences in CO2 emission from electricity also affect a number of other key figures such as those for liquid oxygen production and activated carbon activation and regeneration. For GAC, the main difference is related to the electricity consumption for activation and regeneration. In other aspects, such as coal mining and transport, there are practically no differences. Since PAC cannot be regenerated, the carbon footprints differ much less, these are mainly related to a different effluent composition in terms of DOC. In addition to the values in kg CO2 per kWh or kg carbon, the technological differences also strongly influence the sustainability values in kg CO2 per cubic metre sewage water. The effect of a higher ozone dose or longer GAC life time due to, for example, a higher DOC concentration, quickly worsens the sustainability score by tens of percent.
Conclusion
Key figures for purification technology for the removal of micro-pollutants from sewage do not have universal validity, they need translation. Working with key figures per m3 and extrapolating from this leads to incorrect choices in the selection of technologies. The authors therefore call on everyone to find out for themselves what the best choice of technology is, based on the specific local situations at the wastewater treatment plants, and what the related costs and carbon footprint would be. Key figures from home and abroad can be used, but they must be carefully translated. In this way, variants can be properly compared and investment decisions can be better substantiated.
Reference list
- STOWA 2015-27 Removal of micro-pollutants from wastewater treatment plant effluents
- STOWA 2017-36 Exploration of technological options for the removal of pharmaceuticals from wastewater
- STOWA 2018- 02 PACAS – Powder carbon dosing in activated sludge for micro-pollutant removal
- STOWA 2018-46 Freshwater plant WWTP de Groote Lucht: Pilot study on ozonisation and sand filtration.
- STOWA 2018-67 Proof of Concept and laboratory research removal of micro-pollutants from sewage effluent with the O3-STEP filter.
- The feasibility studies in the Innovation Programme Micropollutants from Water, of STOWA and Ministry of Infrastructure and the Environment, see here
- STOWA 2020-41 Pilot study comparison oxidative techniques effluent Aarle-Rixtel wastewater treatment plant
- URLs websites
- www.micropoll.ch
- www.koms-bw.de
- www.dwa-nrw.de


