
Please note that this article was previously published in H2O’s Water matters
Summary:
Water managers are generally focused primarily on the sources of contamination in their own water system, but it is sometimes desirable to have insight into sources elsewhere. This article describes a new method to identify the load from upstream waters to a point downstream. The method makes iterative use of a water quality model (hydrology, emissions) and concentrations measured in the surface water. The model can determine the origin – spatially, according to source type and quantity – for each substance at any location. As such, the method is useful in the collaboration between water managers, in the search for measures to improve water quality, and in the predictive quantification of the effects of measures.
Introduction:
Excesses above the standard of some substances in the river Meuse cannot be explained by the direct feed flow from abroad (via Eijsden) and the activities within the Directorate-General for Public Works and Water Management’s own management area. The Directorate-General for Public Works and Water Management needed a better understanding of the load of substances from regional waters. The same question was equally relevant for the regional water managers considering their mutual load and that from foreign regional waters. A method was needed to trace the origin of pollutants.
Process:
We used a model that links emissions data from the Netherlands Pollutant Release & Transfer Register to the hydrology from the Water Framework Directive (WFD) Explorer (see box). This enabled us to calculate the concentration of a substance at any given location. We then compared the results with measurements, and optimised the model based on this. It was essential to include knowledge about the sources and the behaviour of substances in this optimisation. Virtual ‘tracers’ are used to determine the source of a substance at any given location. These tracers can be used to determine which management area and what source type the substance originated from.
Framework:
WFD Explorer
The WFD Explorer analyses the effectiveness of potential WFD measures and packages of measures on the chemical and ecological quality of surface waters. The tool thus provides insight into how WFD objectives can be achieved. Examples of measures include tackling point sources (such as wastewater treatment plants) and diffuse sources (such as agriculture and traffic), stream re-meandering or the construction of near-natural riparian zones.
See also www.deltares.nl/en/projects/water-framework-directive-explorer.
Establishing the model:
We developed and optimised the method using four substances (Osté and Altena, 2019): carbamazepine, fluoranthene, cobalt and zinc. These substances vary in chemical properties and use, and the available information is not the same for all four. Most is known about zinc: sources and measurement data. In the case of cobalt, for example, data on discharges to surface water are incomplete, mainly because leaching from the ground is not known. For carbamazepine, we have a fairly accurate understanding of the scope of the sources, but there are few monitoring data. Atmospheric deposition is the main source of fluoranthene.
The use of virtual tracers enables the model to be used to estimate the origin and scope of sources or to estimate the locations where the highest concentrations can be expected
The WFD Explorer Meuse schematisation (Meijers, 2018) was used for the calculations. Based on data from the Emissions Register (Netherlands Pollutant Release & Transfer Register, 2019) point sources and diffuse sources of zinc, cobalt, carbamazepine and fluoranthene were added to this schematisation. These point sources relate to industrial and municipal wastewater treatmentplants; they have been imported in the WFD Explorer at the location of their discharge point. In addition to these internal sources, the smaller waters in the Meuse basin that cross management borders are also important. For these water bodies, a concentration for the respective substances was determined on the basis of measurement data at or close to the boundary point. The water managers provided monitoring data in this respect.
Retention:
For zinc, the loads of foreign water bodies can be calculated and all national sources are recorded in the Emissions Register. Furthermore, the water managers monitor zinc at a lot of locations, which means that there are plenty of validation points available. Zinc was therefore a good candidate to test and calibrate first within the model. It appears that the zinc concentrations calculated are considerably higher than the concentrations measured (figure 1). This applies not just to larger water bodies, but also to local waters. Since a lot of research has already been conducted into all point sources, we assume that the emissions are correct. We concluded that zinc ‘disappears’ via retention in small waters, i.e. the sequestration of substances in, among other things, the sediment. A retention factor was calculated based on the difference between the measured and the calculated concentrations in the small waters. Calculation with the retention factor in small waters also resulted in higher zinc concentrations for the larger waters that were more in line with actual measurements.
‘Statistical estimation’ of sources:
Whereas a lot of data are available for zinc, some of the information regarding monitoring data and sources is missing for a lot of other substances. For cobalt, for example, a lot of measurements are available, but knowledge about the sources is lacking. These calculations resulted in considerably lower concentrations than the measured values (figure 1). The main reason is probably that cobalt leaching from soils is not recorded in the Emissions Register, and that this source is therefore not included in the calculation. To enable leaching to be modelled, this was estimated on the basis of the difference between the measured and the modelled concentrations. The spatial distribution in regional waters of this concentration difference can provide information on differences in the intensity of leaching. This allows us to estimate a source for which there are no emission figures available. Based on the difference in measured and modelled concentrations, leaching is estimated at 11 grams/ha/annum. This value is applied uniformly across the whole Meuse basin.
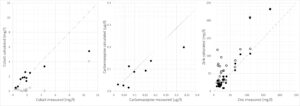
Figure 1. Comparison of measured (x-axis) and calculated (y-axis) values for the modelled substances For cobalt and zinc, the open circles are from before calibration (‘statistical estimation’ or retention) and the filled circles are from afterwards. Due to the space limitation, the results for fluoranthene are not presented here.
Adjusting the monitoring network:
Sources for the medicine carbamazepine are well known (wastewater treatment plants and domestic wastewater via septic tanks), but the volume of measurement data is very limited. Therefore, a model calculation using data from the Emissions Register was performed for this substance, with no further adjustment of the model (see figure 1). For water bodies for which there is little or no measurement data on a specific substance, the tool provides an initial indication of expected concentrations. This can help to decide on the locations where it is useful to monitor, for example because high concentrations are expected at a specific intake point. This is subject to a degree of retention and/or decomposition being known.
Analysis of source to map out shifting:
The method developed has been applied to the Dutch Meuse river basin for four substances. The calculations from the model indicate that the regional load on the Meuse at Keizersveer (just before the Biesbosch) is greater than the foreign load from Belgium entering at Eijsden. Regional sources thus make up a large part of total load. Furthermore, the concentrations in the regional waters are higher because the flow is relatively small there (figure 2). It should be noted, however, that a large proportion of this inland load originates from regional cross-border waters. The amount from the Brabantse Delta Water authority is very small because this water authority mainly drains into the Meuse after Keizersveer. Also mixing with Rhine water takes place in that area.
In terms of zinc and cobalt concentrations, there is an upwards trend between Eijsden and Keizersveer; for fluoranthene, conversely, a clear decline is visible. In all cases, the method developed can be used to state whether the increase or decrease is domestic or from abroad. One of the practical implications of this is that the method developed can be used to make shifts visible, and that any exceeding of the standards can therefore not be solved within the respective water manager’s management area alone.
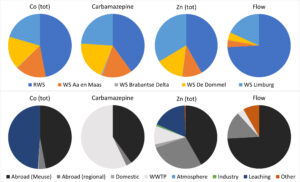
Figure 2. Origin of the load into and the flow from the Meuse at Keizersveer, by water manager and flow type The flow from abroad is thus allocated to the water manager where the foreign body of water enters the Netherlands. Due to the space limitation, the test data for fluoranthene are not presented here.
Quantifying the effect of measures:
Determining the origin provides transparency into the relevant source(s), and thus provides an indication of potential measures. The model can also be used to quantify the effect of a potential measure. There are different types of measures that can be calculated, such as locally or regionally reducing diffuse sources, adjusting point source emissions or adding settling pits to the water system. As an example, the effect on the Meuse of a 90% reduction in carbamazepine emissions by all the wastewater treatment plants in the De Dommel Water Authority was calculated (figure 3).
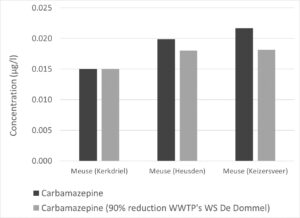
Figure 3. Effect of a hypothetical measure (90% reduction in carbamazepine emissions by all wastewater treatment plants in De Dommel Water Authority) on concentrations of carbamazepine in the Meuse calculated using the model
Conclusions:
The method developed – linking the WFD Explorer model (hydrology) and the Netherlands Emissions Register (emissions) – yields concentrations of substances that are not always in line with measurement data and what is known about sources. For the calibration step, the model uses knowledge about the behaviour of substances, depending on the available information:
- Retention or supply to the water system (if information about sources and concentrations is easily available);
- ‘Statistical estimation’ of sources (if knowledge of the sources is incomplete and the model underestimates the concentrations measured).
If there are little monitoring data available, but there is reliable information regarding sources, the model results provide an initial indication of the concentrations that can be expected at a location.
The model can also provide quantitative predictions regarding the (change in) concentrations when emission-reducing measures are implemented.
Furthermore, by using virtual ‘tracers’ at any desired location, the model can indicate the site of the sources that are responsible for the substance concentration found; a useful tool for engaging in conversation with other managers.
References:
- Osté, L. and Altena, W. (2019). Ontwikkeling methode afwenteling stoffen in het Maasstroomgebied, Deltares rapport 11203432-002-ZWS-0003.
- Meijers, E. (2018). Verbetering hydrologische schematisatie KRW-Verkenner Maas t.b.v. bronnenanalyses, Deltares memo.
- Nederlandse EmissieRegistratie (Netherlands Pollutant Release & Transfer Register), emissieregistratie.nl, consulted: 13-02-2019.

